Energy and climate
In the coming years, UM will address climate change by reducing our energy consumption, switching to the use of sustainable energy and using fossil fuels more efficiently. Here you can find more information about:
- Energy crisis
- Climate policy
- Multi-year agreements energy efficiency
- Greening monumental buildings
- Green electricity and solar park Belvédère
- CO2 footprint
- Energy performance
Energy crisis
Because of the energy crisis in Europe, UM has affiliated itself to the national energy savings campaign ‘Zet ook de knop om’ (Turn it down). This means that in all university buildings the heating has been set 2 degrees lower and the cooling system 2 degrees higher. Moreover, other measures have been taken to reduce the energy usage, like reducing unnecessary lighting, reviewing building opening hours and optimising climate installations and ICT equipment. Next to this, UM started a process to speed up sustainable investments, such as switching to LED-lights in all buildings and insulating monumental buildings. For the monumental buildings, the focus lies on better window insulation. This is to save energy and to improve the comfort of the indoor climate.
Climate policy
The Paris Climate Agreement of 2015 says to limit global warming to less than two degrees Celsius compared to the pre-industrial era and to strive to keep global warming to 1.5 degrees. For the Netherlands this has been translated into a reduction of greenhouse gases of 49% and 95% in 2030 and 2050 compared to 1990, respectively. UM's ambition is to be in line with the Dutch climate targets. UM is working on a road map for reducing energy consumption in buildings and phasing out natural gas. Additionally, UM is taking measures to provide an insight into the indirect emissions of the chain and to reduce these emissions by setting requirements for suppliers and stimulating sustainable mobility. Read more about tackling indirect emissions from mobility.
Multi-year agreements Energy Efficiency
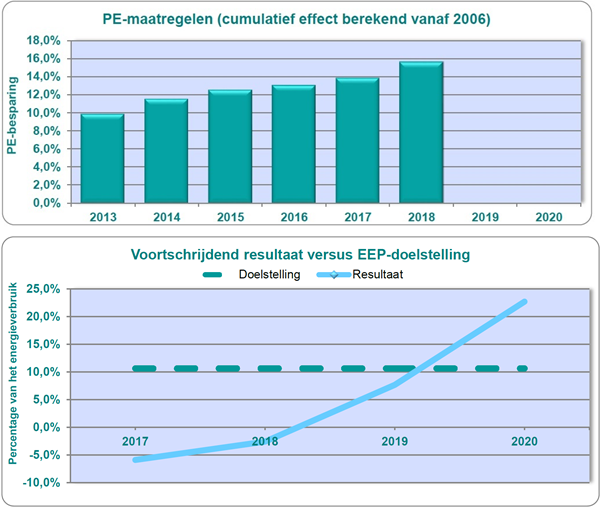
UM participated in the Long-Term Energy Efficiency Agreements (MJA3). The agreement ran up until 2020 and aimed to increase an energy efficiency of the participants by implementing energy-saving measures and reviving renewable energy. Examples of energy-saving measures that UM implemented include isolating the building envelope, heat recovery from ventilation air, the use of electric heat pumps, replacement of fluorescent lighting by LED and CO₂ controlled ventilation of lecture halls. The graph below shows the results of realised measures in regards to the aimed goals. The complete report can be downloaded here.
Making monumental buildings and Tapijn sustainable according to BREEAM-NL
Almost all university buildings in Maastricht city centre have a monumental status. This makes the task of sustainability within the framework of the climate agreement even more challenging. Building physics interventions such as insulation can lead to moisture and mildew and thus damage the building. The municipality demands that monumental values, such as historic window frames and drawn glass, be preserved as far as possible. For the time being, these buildings cannot do without natural gas-fired boilers. Up until 2030 the focus lies on improving insulation (window insulation) and embedding hybrid heat pumps.
At the same time, UM is gaining practical experience in making monuments more sustainable, with particular attention to health and wellbeing. In the redevelopment of Tapijn, a former barracks site with monumental buildings, the sustainability standards BREEAM-NL and WELL-building are applied. During the renovation, the buildings are being fully insulated; moisture and mould problems are prevented by means of a box construction. Thanks to the high energy efficiency and the connection to the Belvédère solar park, the renovated buildings and new construction of phase 1 are energy-neutral.
Green electricity
UM has many buildings, but only few roofs are suitable for solar panels. So far, 640 PV panels have been installed on roofs, covering approximately 1% of the power consumption.
On 4 December 2019, UM signed a Maastricht Energy Agreement with Bodemzorg Limburg and the municipality of Maastricht for the realisation of a solar park in Maastricht. At the former Belvédère landfill site, 30,000 solar panels are installed with a capacity of approx. 12 MWp. In August 2020, the solar park has been put into use. The university financed half of the solar park and in return will receive 50% of the generated green electricity in the form of guarantees of origin (GOs). In 2023, the UM-part of the solar park produced 5.202 MWh solar power, covering 25% of the power consumption of UM buildings in Maastricht.
UM also receives electricity through MUMC+. The remaining power consumption is made greener through the purchase of GvOs from Dutch solar and wind power.
CO₂ footprint
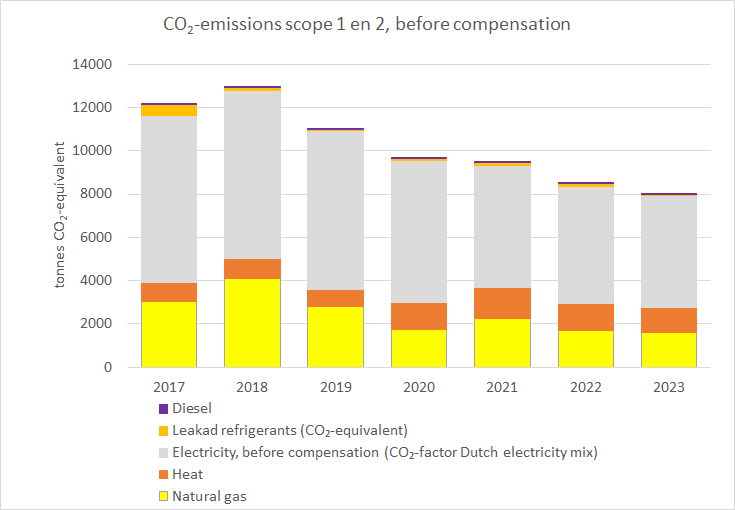
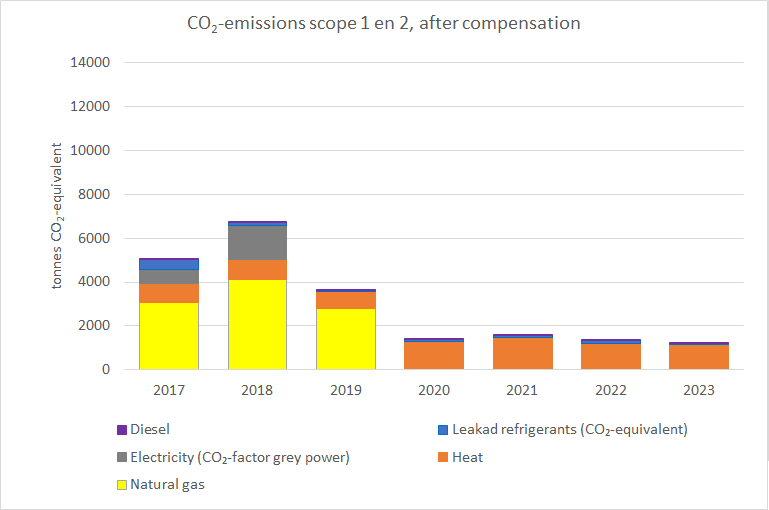
UM applies the guidelines of the Greenhouse Gas Protocol when determining its CO₂ footprint. These distinguish between scope 1, 2 and 3 emissions.
- Scope 1 concerns direct emissions of greenhouse gases due to, among other things, combustion of natural gas in boilers and leakage of refrigerants. Since 2020, the natural gas purchased will be 100% compensated by means of Gold Standard CO₂ certificates.
- Indirect emissions from purchased electricity fall within scope 2. By purchasing 100% green electricity from the sun or wind, from 2019 there will be no CO₂ emissions in scope 2.
- Scope 3 covers other indirect emissions, such as commuting, emissions from business travel, use of products or services and processing of waste. UM is working on an insightful overview of these emissions. In addition, different measures are taken to further reduce scope 3 emissions, e.g. by stimulating load infrastructure and stimulating suppliers through award criteria in tenders. For more information about reducing emissions by plane travel, we refer to our campaign Take the green seat.
The CO₂ footprint for scope 1 and 2 has decreased in recent years.
Energy performance
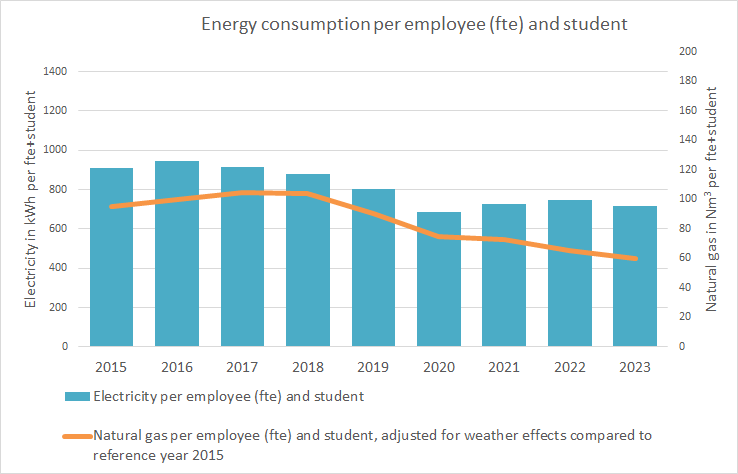
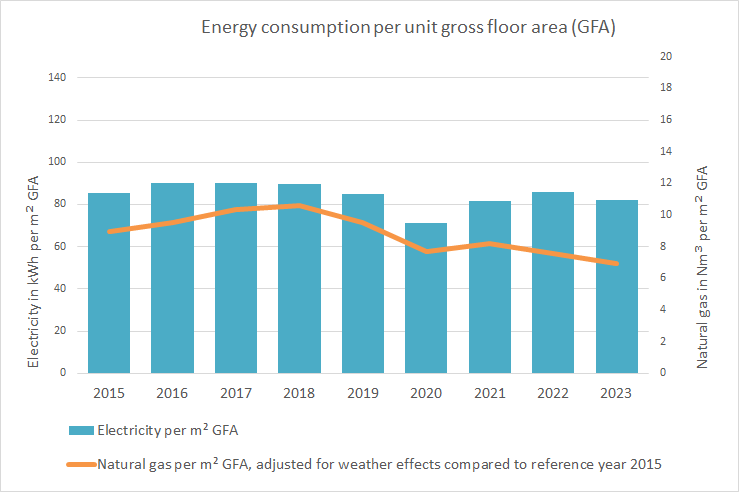
The energy performance of UM buildings is expressed in energy use (electricity and natural gas) per employee (FTE) and student or per unit of floor space. The graphs below show the energy performance for the period 2015-2022. Natural gas consumption has been corrected for annual fluctuations in temperatures during the heating season.
